Trade shows put your competitors’ pricing, product roadmap, and stand investment in plain sight for three days. Most UK exhibitors walk past it. A structured CI plan turns ExCeL or NEC Birmingham into the cheapest market research you’ll do all year.
Most UK exhibitors leave the show floor with a list of leads and almost nothing else. Their competitors spent the same three days quietly putting pricing, product roadmap signals, market positioning, and staffing models on public display, and the people best placed to capture it walked past with their badges down.
Competitive intelligence at trade shows is one of the most underused sources of B2B market research in the UK. The cost of ignoring it shows up in next year’s pricing meetings and product reviews.
ExCeL London, NEC Birmingham, Olympia London, and Manchester Central host the kind of dense competitor concentration no email campaign or LinkedIn scrape can match. A CI analyst, business development manager, or industry observer with a clear plan can come back with insights that take a research agency weeks to produce.
Why Trade Shows Are an Underused Source of Competitive Intelligence
The headline figure exhibitors use to justify stand spend is also the figure that makes trade shows the highest-yielding environment for observing competitors anywhere in B2B.
CEIR (the Center for Exhibition Industry Research, the official research division of the International Association of Exhibitions and Events) reports that 81% of trade show attendees have buying authority and 92% are specifically looking for new products.
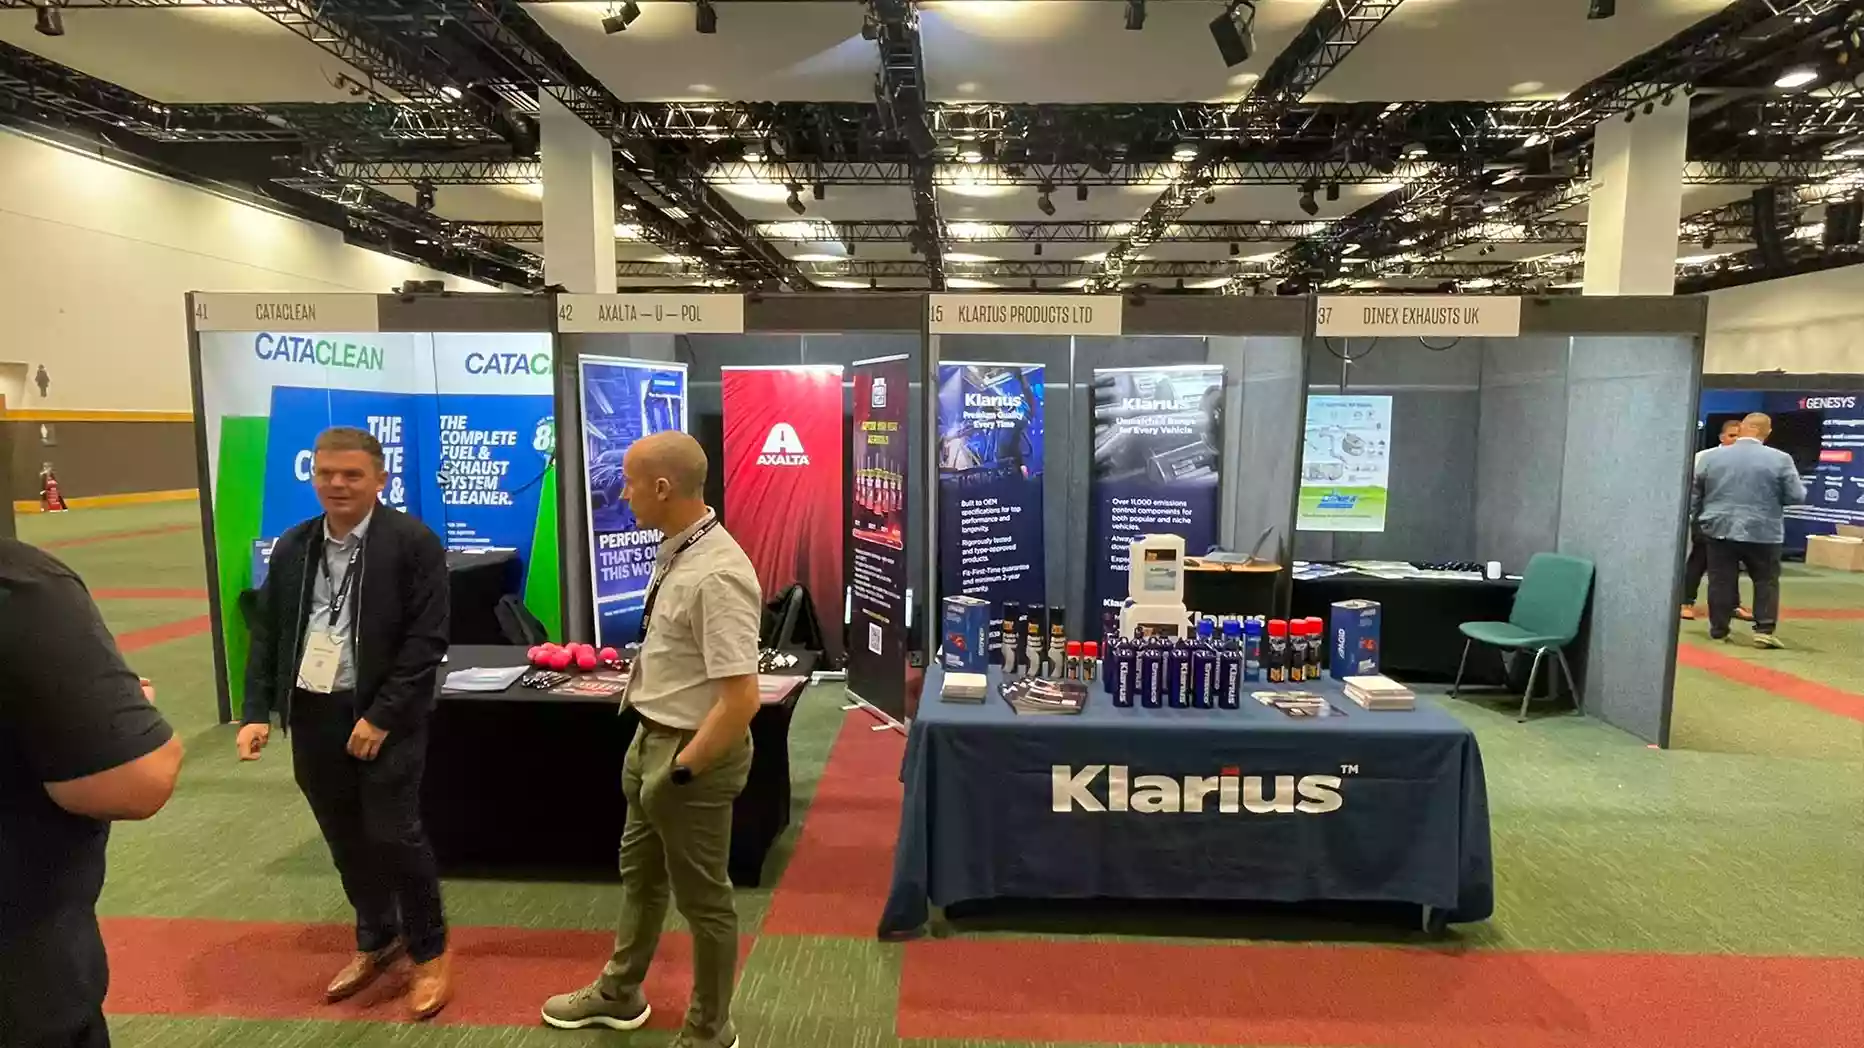
Every competitor on the floor has invested heavily to be there. They have put on display:
- Their best pricing on visible quotes.
- Their newest product in the demo loop.
- Their most senior people on the stand.
- Their marketing positioning in the graphics behind them.
For three days, information normally locked behind the sales gatekeepers, NDAs, and pricing teams is sitting on the aisle. You are not buying, you are evaluating, and the show is set up to help you do exactly that.
What to Observe on a Competitor’s Exhibition Stand
Competitor observation works best when it’s structured. Walking a stand without a framework produces general impressions and not much else. The signals worth capturing fall into five categories, and each one tells you something specific about how the competitor is positioned for the year ahead.
Stand Build and Investment Signals
The build itself is the first data point. A competitor who has moved from a 3 m × 2 m shell scheme last year to a 50 m² custom exhibition stand this year is telling you their budget priorities have shifted, often before they have announced anything publicly. What to record:
- Build type (shell scheme, modular, full custom).
- Approximate floor space.
- Ceiling height and lighting quality.
- AV installed (LED walls, projectors, sound systems).
- Hanging signage and structural elements.
LED screens are particularly readable. What they’ve installed tells you what they’ve prioritised:
| What you see | What it signals |
| Wall of high-resolution LED screens running animated demos | Significant investment in visual storytelling, refreshed marketing strategy |
| Premium AV setup with line-array sound and 4K LED walls | Serious commercial confidence, large stand budget |
| Smaller pop-up screens with looped slides | Budget went elsewhere this year |
| Basic projector and pull-up banners | The show is not a commercial priority |
Compare what each competitor is running this year against the same show last year. The trend is usually obvious within ten minutes of walking the aisle.
Staffing and Engagement Signals
Who’s on the stand and what they’re doing tells you almost as much as the build. Senior staff on the floor, particularly product leads or commercial directors, signal that the competitor sees the show as strategically important. Junior staff or external promotional teams suggest the opposite.
Three things to watch:
- Demo cadence: How often do live product demos run, and how full is the demo area each time?
- Qualification style: A team that asks tight qualification questions before pitching is operating a mature sales motion. A team that pitches everyone who slows down is usually earlier in their commercial maturity or chasing volume targets.
- Foot traffic: Count visitors stopping at a stand across three timed five-minute windows, morning, post-lunch, late afternoon. Do the same for two or three direct competitors.
Foot traffic patterns, compared with your own stand performance, tell you something concrete about relative draw, regardless of stand spend.
What to Capture on Pricing, Product, and Positioning
Build and staffing signals are the easy half. The harder half is the commercial intelligence, pricing, product roadmap, and market positioning, and capturing it well is what separates a useful CI report from a list of impressions.
Pricing Strategy and Pricing Gap Signals
Competitors rarely publish full price lists at trade shows, but the signals are there if you know what to look for:
- What’s printed in the literature versus what’s quoted only on request.
- Which tier do they lead with on visible signage?
- Whether they’re running show-specific promotional offers, and what the discount logic looks like.
- Whether they offer instant quotes via tablet or push every conversation to a follow-up call.
Capture price points verbatim. Note the framing language around them.
“From £499 per month” reveals the entry tier. “Enterprise pricing on request” usually means the published rate is a hook, and the real number is significantly higher.
Pricing gap analysis becomes possible when you have these data points across three or four competitors, mapped against your own pricing in the post-show report.
Product Roadmap Signals
Look at what’s being demoed live, what’s on the “coming soon” wall, what integration partner logos sit alongside their own product, and what language they are using to describe the demo. Phrases like “Now with AI” or “built for compliance” are positioning signals about which themes their product team has prioritised for the next twelve months.
What’s fair game to collect:
- Brochures, one-pagers, sell sheets, roadmap teasers.
- Photographs of demo screens running publicly.
- The standard demo script (most competitor staff will run it for any visitor who asks).
None of this is covert. It is the information they’ve chosen to make public.
How to Capture What You Observe Without Looking Suspicious
The capture method matters as much as what you capture. The goal is usable notes you can write up the same evening, not blurred phone photos and scribbled half-sentences you can’t decode three days later.
The Ethics Line
This is where CI gets misunderstood. The boundary is clear, and most teams cross it accidentally rather than deliberately.
Standard Practice (Ethical and Legal)
- Observing publicly displayed information.
- Photographing stand graphics, demo screens, signage and printed literature.
- Picking up brochures and signing up for newsletters with a real work email.
- Polite identification when asked who you are.
- Listening to standard demo scripts run for any visitor.
Crossing the Line (don’t do this)
- Pretexting, pretending to be a buyer when you are not.
- Photographing staff or badges.
- Entering private meeting areas.
- Recording audio of conversations.
- Misrepresenting your company affiliation.
If you want to talk to staff, be straightforward about who you are. Most competitor staff will speak openly with anyone who introduces themselves honestly, including someone from a competing brand. Pretexting tends to backfire when the competitor recognises you at the next show. The Strategic and Competitive Intelligence Professionals (SCIP) Code of Ethics draws this line clearly.
Capture Tools That Actually Work
A simple template on a phone or tablet works well. Pre-load the categories, build, staffing, pricing, product, positioning, and fill in each section as you visit each competitor. A note app with voice memos works just as well for someone walking solo.
The UK Show Floor: Venue-Specific CI Considerations
The fundamentals of CI don’t change between venues, but the way they play out does. Hall layout, visitor density, and stand spacing affect how easy it is to observe competitors without standing out, and how much you can realistically cover in a day.
| Venue | CI Advantage | CI Challenge | Realistic Coverage Per Day |
| ExCeL London | Linear halls cluster competitors on the same aisle for easy side-by-side comparison | Visibility cuts both ways; staff notice if you linger | 3–5 direct competitors |
| NEC Birmingham | Lower hall density, less conspicuous observation | Direct competitors are often in different halls, requiring more walking | 3 competitors |
| Olympia London | Compact and workable in a single morning | Smaller aisles mean repeated encounters with competitor staff | 3–4 competitors |
| Manchester Central | Relaxed pace, suits slower thorough observation | Sector-specific shows mean a narrower visitor profile | 3–4 competitors |
ExCeL London
ExCeL’s halls are long and linear, which means competitors at the same show often cluster along the same aisle in the same product category. Plan a route that loops the hall twice, shorter stops on the first pass, longer ones on the second.
NEC Birmingham
The NEC’s halls are larger and more spread out, so CI walks take longer and require more planning. Build extra time into the day, and split competitor coverage across multiple team members if you have them.
Building the Post-Show Competitive Intelligence Report
A CI report that doesn’t get used is wasted effort.
Sales leadership, product, and marketing won’t read a three-page document. The structure that works for most UK B2B brands is four parts.
Part 1: One-Page Executive Summary
- Three competitors, three findings each.
- Written as direct statements, not observations.
Competitor A has moved to mid-market pricing’ is an observation. ‘We need to review our mid-tier pricing before Q1’ is something leadership can act on.
Part 2: Detailed Competitor Profiles
- One page per competitor.
- Structured to the same five observation categories used on the floor.
- Photos and literature attached as appendices.
Part 3: Pricing Gap and Market Positioning Map
This is usually the highest-value output. A two-axis chart:
- X-axis: price point (low to high).
- Y-axis: Product breadth (narrow to broad).
- Each competitor plotted, your own brand marked alongside.
If three competitors are clustered in a position you’re not, that’s a market share question for next year.
Part 4: Action List for Sales, Product, and Marketing
Each finding maps to a specific team and a specific recommendation. Tie the report into your broader trade show measurement framework. Our piece on how to measure trade show effectiveness covers how CI value sits alongside lead value in the same ROI calculation.
How Strong UK Teams Turn CI Into Pipelines
The teams that get the most from competitive intelligence don’t treat it as a one-off post-show write-up. They feed it into the next year’s planning cycle as a structured input:
- Pricing reviews use the pricing gap data.
- Product roadmap meetings reference what competitors demoed.
- Marketing positioning workshops start from the messaging map captured on the floor.
The same trade show that generated 80 leads also generated three months of competitive intelligence informing the next twelve months of decisions. Plug that intelligence into the trade show event marketing plan for the year ahead, and the show pays back twice.
The strongest teams do one more thing: they structure the show day so observation is actually possible.
Most exhibitors are too stretched on the floor to do CI properly because staff are running demos, capturing leads, troubleshooting AV, and managing logistics. Brands that use comprehensive exhibitor services to handle the operational layer free their senior people to walk the floor with a notebook.
A Pre-Show CI Briefing Template
A half-hour briefing the week before makes the difference between structured CI and three random photos on a phone.
Targets and Team
- Pick three to five direct competitors as primary targets.
- Add two adjacent-sector competitors as secondary.
- Assign one named observer to each, with backups.
Method
- Agree on the five observation categories: build, staffing, pricing, product and positioning.
- Set timed foot traffic windows: 11 am, 2 pm, 4 pm.
- Confirm the capture template: phone note app, tablet form, or shared doc.
Boundaries
- Brief the team on what to photograph and what not to.
- Confirm the ethics line: honest identification if asked, no pretexting.
Debrief
- Schedule a 45-minute debrief at the end of each show day, on-site if possible.
- Agree the post-show report deadline, within seven working days.
Next Steps
EMS Exhibitions, which manage stand designs, AV setups, or exhibitor service structures that free your senior team to walk the floor, we’re happy to talk it through. We’ve built stands and run on-floor support for exhibitors at ExCeL London, NEC Birmingham, Olympia London, and Manchester Central.
Contact 020 7820 8006 or email at [email protected].
Common Questions About Competitive Intelligence at Trade Shows
- Is competitive intelligence at trade shows legal in the UK?
Observation of publicly displayed information is standard practice and legal. Photographing stand graphics, demo screens, and printed literature is acceptable. Pretexting, recording private conversations, or accessing restricted areas is not.
- Who should do CI work on the show floor?
A dedicated observer rather than someone working the stand. CI requires concentration that’s incompatible with running demos or capturing leads. A competitive intelligence analyst, business development manager, or product manager with no stand duties is the typical choice.
- How many competitors can one person realistically cover in a day?
At ExCeL London, three to five direct competitors with proper observation depth. At NEC Birmingham, three at most, because of the floor size. Trying to cover more produces shallow notes that aren’t usable in the report.
- What’s the most valuable single piece of CI to capture?
Pricing signals, particularly the gap between published entry-level pricing and “on request” enterprise tiers. This data point informs product, sales, and marketing decisions simultaneously and is rarely available outside trade shows.
- How long should the post-show CI report take to produce?
Within seven working days of the show closing. The one-page summary should land within three days, while observations are still sharp.